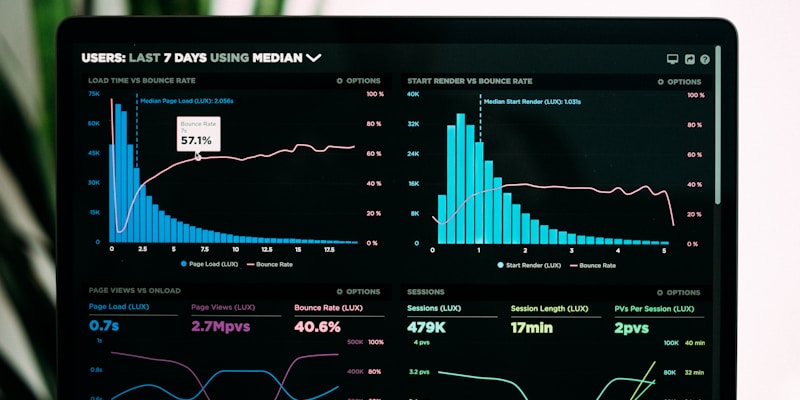
The last decade of analytics tooling was spent on the dashboard. Self-service BI, drag-and-drop charts, automated reports — all of it aimed at the same assumption, which is that the bottleneck was visualisation. Anyone who has sat in a review meeting knows the bottleneck was never the chart.
Analytics stalls at two points. Before the work, when nobody can state the question precisely enough to answer. After the work, when the result exists and nobody can explain what it means to someone who will make a decision. AI tools help at both, and the ones that only generate SQL are solving the part that was already easy.
The five stages, and which ones AI touches
- Framing the question. What decision does this analysis change?
- Getting data into shape. Joins, cleaning, definitions.
- Analysis. The actual computation.
- Explanation. Why the number moved, and what it does not prove.
- Presentation. Getting a non-analyst to act on it.
AI is weak at stage one unless used deliberately, moderate at two, strong at three, surprisingly useful at four, and genuinely good at five. Most "AI analytics" products concentrate on stage three because it is the easiest to demo.
Stage one: framing the question
The most valuable ten minutes of any analysis is turning a vague request into a falsifiable one. "How are we doing?" becomes "did the change to onboarding increase week-two retention for self-serve signups, and by how much".
ChatGPT is useful here as a sparring partner. Describe the decision that is waiting on the analysis, and ask what evidence would actually change it. That framing step catches analyses that cannot influence anything before they consume a week.
Perplexity AI helps when the question is about the outside world rather than your own data: what a benchmark typically looks like, how competitors define a metric, whether a widely quoted figure has a source. The citations are what make it usable in a meeting.
Neither tool knows your business. Their value is in forcing precision, which is a writing task more than a data task.
Stage two and three: where the computation happens
Noteable is the tool closest to how analysts actually work. It is a notebook that combines code cells, written notes and visualisations in one document, with an AI layer that generates transformation and plotting code from plain descriptions. The important property is that the analysis stays inspectable: a colleague can read the code, rerun it and see where a number came from.
That matters more than speed. Most analytics distrust comes from numbers nobody can reproduce, and a notebook that mixes explanation with code is the cheapest defence against it.
Claude is strong on the reasoning layer around the code — reading a schema, proposing a definition, explaining why two queries disagree. Its long context makes it practical to paste a full query and a sample of results and ask what is wrong.
ChatGPT handles the ad hoc case: writing a regex, translating a pandas operation, explaining an error message. It is the tool most analysts already have open, and the one most likely to produce a confident wrong join condition. Verify every generated query against a known total before trusting it.
Stage four: explaining what the number means
This is the stage AI helps with most and where teams spend least time. A number without an explanation gets argued about rather than acted on.
The useful pattern is adversarial. Give the model the result and ask it to list the alternative explanations that would produce the same number. A retention drop that coincides with a pricing change, a tracking release and a seasonal dip has three plausible causes, and an analysis that names only one is a hypothesis, not a finding.
ChatPDF is practical for the documents that surround a result: a vendor's methodology note, a contract's definition of a metric, a previous quarter's report. Asking specific questions of a long PDF is faster than searching for the paragraph.
Stage five: presenting to people who will not read a chart
Gamma generates a first-draft deck from an outline and exports to web, PDF or PowerPoint. For an internal readout, the first draft is most of the work, and the tool keeps theming consistent so the deck looks deliberate rather than assembled.
The discipline is to write the argument as an outline before generating. A deck generated from "Q3 results" is a set of slides. A deck generated from "three findings, the decision each implies, and the one number that would change our mind" is a presentation.
When the question is research rather than business
Two tools cover the literature-shaped version of analytics, where the data is published studies rather than your own tables.
Consensus searches academic papers and surfaces what studies say about a specific claim, which is useful for validating an assumption before building a model on it.
Semantic Scholar is free and broader, with AI summaries for screening papers. Both are screening tools: the summary tells you whether to read the paper, not what the paper found.
When to build instead of buy
LangChain is the layer to reach for when the analysis needs to run repeatedly against live data rather than in a notebook — retrieval over documents, tool calls against internal systems, and tracing to see why an answer came out the way it did.
Hugging Face matters when the task needs a specialised model rather than a general one: classification, extraction or scoring at volume, where a fine-tuned open model is cheaper and more predictable than prompting.
Most teams should not start here. Building is justified when a workflow is stable enough to automate and frequent enough to matter.
The verification problem
Three failure modes recur, and none is solved by a better model.
Confident arithmetic. Models narrate calculations they cannot actually perform. Any number that will be quoted needs to come from executed code, not from prose.
Definition drift. Two teams computing "active user" differently will produce two correct answers that disagree. AI will happily help with both.
Survivorship in the framing. A model asked to analyse the data you have will analyse the data you have, including whatever is missing from it.
A stack that matches the stages
| Stage | Tool | Why |
|---|---|---|
| Frame the question | ChatGPT | Forces a falsifiable statement |
| External context | Perplexity AI | Cited benchmarks and definitions |
| Reproducible analysis | Noteable | Code, notes and charts in one document |
| Explain the result | Claude | Reasons about schema and definitions |
| Read the paperwork | ChatPDF | Interrogate long methodology documents |
| Present it | Gamma | First-draft deck from an outline |
| Automate it | LangChain | Only once the workflow is stable |
The short version
Dashboards made charts cheap and left the hard parts untouched. AI tools that help with framing and explanation are worth more than tools that help with query writing, because query writing was never where the week went.
Buy for stages one, four and five. Use the free tier for stage three, and verify every number that leaves the notebook.